
Updated Apr-2026 Pass Associate-Developer-Apache-Spark-3.5 Exam - Real Practice Test Questions
Download Free Databricks Associate-Developer-Apache-Spark-3.5 Real Exam Questions
NEW QUESTION # 70
Which configuration can be enabled to optimize the conversion between Pandas and PySpark DataFrames using Apache Arrow?
- A. spark.conf.set("spark.sql.execution.arrow.enabled", "true")
- B. spark.conf.set("spark.sql.execution.arrow.pyspark.enabled", "true")
- C. spark.conf.set("spark.pandas.arrow.enabled", "true")
- D. spark.conf.set("spark.sql.arrow.pandas.enabled", "true")
Answer: B
Explanation:
Apache Arrow is used under the hood to optimize conversion between Pandas and PySpark DataFrames. The correct configuration setting is:
spark.conf.set("spark.sql.execution.arrow.pyspark.enabled", "true")
From the official documentation:
"This configuration must be enabled to allow for vectorized execution and efficient conversion between Pandas and PySpark using Arrow." Option B is correct.
Options A, C, and D are invalid config keys and not recognized by Spark.
Final answer: B
NEW QUESTION # 71
An engineer wants to join two DataFrames df1 and df2 on the respective employee_id and emp_id columns:
df1: employee_id INT, name STRING
df2: emp_id INT, department STRING
The engineer uses:
result = df1.join(df2, df1.employee_id == df2.emp_id, how='inner')
What is the behaviour of the code snippet?
- A. The code fails to execute because the column names employee_id and emp_id do not match automatically
- B. The code fails to execute because PySpark does not support joining DataFrames with a different structure
- C. The code fails to execute because it must use on='employee_id' to specify the join column explicitly
- D. The code works as expected because the join condition explicitly matches employee_id from df1 with emp_id from df2
Answer: D
Explanation:
In PySpark, when performing a join between two DataFrames, the columns do not have to share the same name. You can explicitly provide a join condition by comparing specific columns from each DataFrame.
This syntax is correct and fully supported:
df1.join(df2, df1.employee_id == df2.emp_id, how='inner')
This will perform an inner join between df1 and df2 using the employee_id from df1 and emp_id from df2.
NEW QUESTION # 72
34 of 55.
A data engineer is investigating a Spark cluster that is experiencing underutilization during scheduled batch jobs.
After checking the Spark logs, they noticed that tasks are often getting killed due to timeout errors, and there are several warnings about insufficient resources in the logs.
Which action should the engineer take to resolve the underutilization issue?
- A. Reduce the size of the data partitions to improve task scheduling.
- B. Increase the number of executor instances to handle more concurrent tasks.
- C. Set the spark.network.timeout property to allow tasks more time to complete without being killed.
- D. Increase the executor memory allocation in the Spark configuration.
Answer: B
Explanation:
Underutilization with timeout warnings often indicates insufficient parallelism - meaning there aren't enough executors to process all tasks concurrently.
Solution:
Increase the number of executors to allow more parallel task execution and better resource utilization.
Example configuration:
--conf spark.executor.instances=8
This distributes the workload more effectively across cluster nodes and reduces idle time for pending tasks.
Why the other options are incorrect:
A: Extending timeouts hides the symptom, not the root cause (lack of executors).
B: More memory per executor won't fix scheduling bottlenecks.
C: Reducing partition size may increase overhead and does not fix resource imbalance.
Reference:
Databricks Exam Guide (June 2025): Section "Troubleshooting and Tuning Apache Spark DataFrame API Applications" - tuning executors and cluster utilization.
Spark Configuration - executor instances and resource scaling.
NEW QUESTION # 73
Given:
python
CopyEdit
spark.sparkContext.setLogLevel("<LOG_LEVEL>")
Which set contains the suitable configuration settings for Spark driver LOG_LEVELs?
- A. WARN, NONE, ERROR, FATAL
- B. ERROR, WARN, TRACE, OFF
- C. ALL, DEBUG, FAIL, INFO
- D. FATAL, NONE, INFO, DEBUG
Answer: B
Explanation:
The setLogLevel() method of SparkContext sets the logging level on the driver, which controls the verbosity of logs emitted during job execution. Supported levels are inherited from log4j and include the following:
ALL
DEBUG
ERROR
FATAL
INFO
OFF
TRACE
WARN
According to official Spark and Databricks documentation:
"Valid log levels include: ALL, DEBUG, ERROR, FATAL, INFO, OFF, TRACE, and WARN." Among the choices provided, only option B (ERROR, WARN, TRACE, OFF) includes four valid log levels and excludes invalid ones like "FAIL" or "NONE".
NEW QUESTION # 74
A data engineer wants to process a streaming DataFrame that receives sensor readings every second with columnssensor_id,temperature, andtimestamp. The engineer needs to calculate the average temperature for each sensor over the last 5 minutes while the data is streaming.
Which code implementation achieves the requirement?
Options from the images provided:
- A.

- B.

- C.

- D.

Answer: D
Explanation:
Comprehensive and Detailed Explanation From Exact Extract:
The correct answer isDbecause it uses proper time-based window aggregation along with watermarking, which is the required pattern in Spark Structured Streaming for time-based aggregations over event-time data.
From the Spark 3.5 documentation on structured streaming:
"You can define sliding windows on event-time columns, and usegroupByalong withwindow()to compute aggregates over those windows. To deal with late data, you usewithWatermark()to specify how late data is allowed to arrive." (Source:Structured Streaming Programming Guide) In optionD, the use of:
python
CopyEdit
groupBy("sensor_id", window("timestamp","5 minutes"))
agg(avg("temperature").alias("avg_temp"))
ensures that for eachsensor_id, the average temperature is calculated over 5-minute event-time windows. To complete the logic, it is assumed thatwithWatermark("timestamp", "5 minutes")is used earlier in the pipeline to handle late events.
Explanation of why other options are incorrect:
Option AusesWindow.partitionBywhich applies to static DataFrames or batch queries and is not suitable for streaming aggregations.
Option Bdoes not apply a time window, thus does not compute the rolling average over 5 minutes.
Option Cincorrectly applieswithWatermark()after an aggregation and does not include any time window, thus missing the time-based grouping required.
Therefore,Option Dis the only one that meets all requirements for computing a time-windowed streaming aggregation.
NEW QUESTION # 75
What is the benefit of Adaptive Query Execution (AQE)?
- A. It optimizes query execution by parallelizing tasks and does not adjust strategies based on runtime metrics like data skew.
- B. It enables the adjustment of the query plan during runtime, handling skewed data, optimizing join strategies, and improving overall query performance.
- C. It allows Spark to optimize the query plan before execution but does not adapt during runtime.
- D. It automatically distributes tasks across nodes in the clusters and does not perform runtime adjustments to the query plan.
Answer: B
Explanation:
Adaptive Query Execution (AQE) is a powerful optimization framework introduced in Apache Spark 3.0 and enabled by default since Spark 3.2. It dynamically adjusts query execution plans based on runtime statistics, leading to significant performance improvements. The key benefits of AQE include:
Dynamic Join Strategy Selection: AQE can switch join strategies at runtime. For instance, it can convert a sort-merge join to a broadcast hash join if it detects that one side of the join is small enough to be broadcasted, thus optimizing the join operation .
Handling Skewed Data: AQE detects skewed partitions during join operations and splits them into smaller partitions. This approach balances the workload across tasks, preventing scenarios where certain tasks take significantly longer due to data skew .
Coalescing Post-Shuffle Partitions: AQE dynamically coalesces small shuffle partitions into larger ones based on the actual data size, reducing the overhead of managing numerous small tasks and improving overall query performance .
These runtime optimizations allow Spark to adapt to the actual data characteristics during query execution, leading to more efficient resource utilization and faster query processing times.
NEW QUESTION # 76
43 of 55.
An organization has been running a Spark application in production and is considering disabling the Spark History Server to reduce resource usage.
What will be the impact of disabling the Spark History Server in production?
- A. Enhanced executor performance due to reduced log size
- B. Loss of access to past job logs and reduced debugging capability for completed jobs
- C. Improved job execution speed due to reduced logging overhead
- D. Prevention of driver log accumulation during long-running jobs
Answer: B
Explanation:
The Spark History Server provides a web UI for viewing past completed applications, including event logs, stages, and performance metrics.
If disabled:
Spark jobs still run normally,
But users lose the ability to review historical job metrics, DAGs, or logs after completion.
Thus, debugging, performance analysis, and audit capabilities are lost.
Why the other options are incorrect:
A: Disabling History Server doesn't manage logs.
B/D: Minimal overhead; disabling doesn't improve runtime speed or executor performance.
Reference:
Databricks Exam Guide (June 2025): Section "Apache Spark Architecture and Components" - Spark UI, History Server, and event logging.
Spark Administration Docs - History Server functionality and configuration.
NEW QUESTION # 77
How can a Spark developer ensure optimal resource utilization when running Spark jobs in Local Mode for testing?
Options:
- A. Set the spark.executor.memory property to a large value.
- B. Use the spark.dynamicAllocation.enabled property to scale resources dynamically.
- C. Increase the number of local threads based on the number of CPU cores.
- D. Configure the application to run in cluster mode instead of local mode.
Answer: C
Explanation:
When running in local mode (e.g., local[4]), the number inside the brackets defines how many threads Spark will use.
Using local[*] ensures Spark uses all available CPU cores for parallelism.
Example:
spark-submit --master local[*]
Dynamic allocation and executor memory apply to cluster-based deployments, not local mode.
NEW QUESTION # 78
A data engineer is working ona Streaming DataFrame streaming_df with the given streaming data: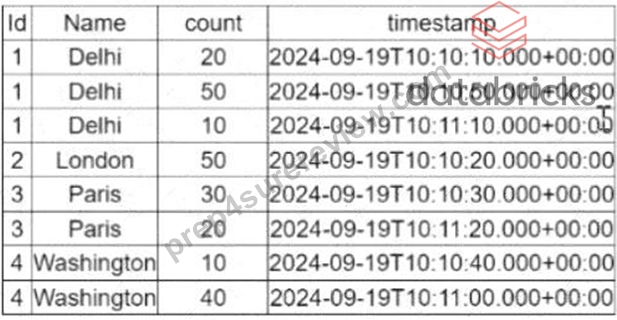
Which operation is supported with streaming_df?
- A. streaming_df.select(countDistinct("Name"))
- B. streaming_df.groupby("Id").count()
- C. streaming_df.orderBy("timestamp").limit(4)
- D. streaming_df.filter(col("count") < 30).show()
Answer: B
Explanation:
Comprehensive and Detailed
Explanation:
In Structured Streaming, only a limited subset of operations is supported due to the nature of unbounded data.
Operations like sorting (orderBy) and global aggregation (countDistinct) require a full view of the dataset, which is not possible with streaming data unless specific watermarks or windows are defined.
Review of Each Option:
A). select(countDistinct("Name"))
Not allowed - Global aggregation like countDistinct() requires the full dataset and is not supported directly in streaming without watermark and windowing logic.
Reference: Databricks Structured Streaming Guide - Unsupported Operations.
B). groupby("Id").count()Supported - Streaming aggregations over a key (like groupBy("Id")) are supported.
Spark maintains intermediate state for each key.Reference: Databricks Docs # Aggregations in Structured Streaming (https://docs.databricks.com/structured-streaming/aggregation.html)
C). orderBy("timestamp").limit(4)Not allowed - Sorting and limiting require a full view of the stream (which is infinite), so this is unsupported in streaming DataFrames.Reference: Spark Structured Streaming - Unsupported Operations (ordering without watermark/window not allowed).
D). filter(col("count") < 30).show()Not allowed - show() is a blocking operation used for debugging batch DataFrames; it's not allowed on streaming DataFrames.Reference: Structured Streaming Programming Guide
- Output operations like show() are not supported.
Reference Extract from Official Guide:
"Operations like orderBy, limit, show, and countDistinct are not supported in Structured Streaming because they require the full dataset to compute a result. Use groupBy(...).agg(...) instead for incremental aggregations."- Databricks Structured Streaming Programming Guide
NEW QUESTION # 79
A data engineer is building an Apache Spark™ Structured Streaming application to process a stream of JSON events in real time. The engineer wants the application to be fault-tolerant and resume processing from the last successfully processed record in case of a failure. To achieve this, the data engineer decides to implement checkpoints.
Which code snippet should the data engineer use?
- A. query = streaming_df.writeStream \
.format("console") \
.outputMode("append") \
.start() - B. query = streaming_df.writeStream \
.format("console") \
.outputMode("complete") \
.start() - C. query = streaming_df.writeStream \
.format("console") \
.option("checkpoint", "/path/to/checkpoint") \
.outputMode("append") \
.start() - D. query = streaming_df.writeStream \
.format("console") \
.outputMode("append") \
.option("checkpointLocation", "/path/to/checkpoint") \
.start()
Answer: D
Explanation:
To enable fault tolerance and ensure that Spark can resume from the last committed offset after failure, you must configure a checkpoint location using the correct option key: "checkpointLocation".
From the official Spark Structured Streaming guide:
"To make a streaming query fault-tolerant and recoverable, a checkpoint directory must be specified using .option("checkpointLocation", "/path/to/dir")." Explanation of options:
Option A uses an invalid option name: "checkpoint" (should be "checkpointLocation") Option B is correct: it sets checkpointLocation properly Option C lacks checkpointing and won't resume after failure Option D also lacks checkpointing configuration
NEW QUESTION # 80
A Spark developer is building an app to monitor task performance. They need to track the maximum task processing time per worker node and consolidate it on the driver for analysis.
Which technique should be used?
- A. Use an accumulator to record the maximum time on the driver
- B. Use an RDD action like reduce() to compute the maximum time
- C. Configure the Spark UI to automatically collect maximum times
- D. Broadcast a variable to share the maximum time among workers
Answer: B
Explanation:
The correct way to aggregate information (e.g., max value) from distributed workers back to the driver is using RDD actions such as reduce() or aggregate().
From the documentation:
"To perform global aggregations on distributed data, actions like reduce() are commonly used to collect summaries such as min/max/avg." Accumulators (Option B) do not support max operations directly and are not intended for such analytics.
Broadcast (Option C) is used to send data to workers, not collect from them.
Spark UI (Option D) is a monitoring tool - not an analytics collection interface.
Final answer: A
NEW QUESTION # 81
A Spark engineer is troubleshooting a Spark application that has been encountering out-of-memory errors during execution. By reviewing the Spark driver logs, the engineer notices multiple "GC overhead limit exceeded" messages.
Which action should the engineer take to resolve this issue?
- A. Modify the Spark configuration to disable garbage collection
- B. Cache large DataFrames to persist them in memory.
- C. Optimize the data processing logic by repartitioning the DataFrame.
- D. Increase the memory allocated to the Spark Driver.
Answer: D
Explanation:
The message "GC overhead limit exceeded" typically indicates that the JVM is spending too much time in garbage collection with little memory recovery. This suggests that the driver or executor is under-provisioned in memory.
The most effective remedy is to increase the driver memory using:
--driver-memory 4g
This is confirmed in Spark's official troubleshooting documentation:
"If you see a lot of GC overhead limit exceeded errors in the driver logs, it's a sign that the driver is running out of memory."
- Spark Tuning Guide
"If you see a lot of GC overhead limit exceeded errors in the driver logs, it's a sign that the driver is running out of memory."
- Spark Tuning Guide
Why others are incorrect:
A may help but does not directly address the driver memory shortage.
B is not a valid action; GC cannot be disabled.
D increases memory usage, worsening the problem.
NEW QUESTION # 82
Given the code: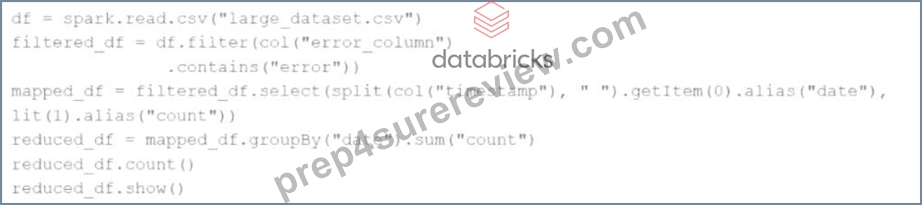
df = spark.read.csv("large_dataset.csv")
filtered_df = df.filter(col("error_column").contains("error"))
mapped_df = filtered_df.select(split(col("timestamp")," ").getItem(0).alias("date"), lit(1).alias("count")) reduced_df = mapped_df.groupBy("date").sum("count") reduced_df.count() reduced_df.show() At which point will Spark actually begin processing the data?
- A. When the show action is applied
- B. When the groupBy transformation is applied
- C. When the filter transformation is applied
- D. When the count action is applied
Answer: D
Explanation:
Spark uses lazy evaluation. Transformations like filter, select, and groupBy only define the DAG (Directed Acyclic Graph). No execution occurs until an action is triggered.
The first action in the code is:reduced_df.count()
So Spark starts processing data at this line.
Reference:Apache Spark Programming Guide - Lazy Evaluation
NEW QUESTION # 83
An MLOps engineer is building a Pandas UDF that applies a language model that translates English strings into Spanish. The initial code is loading the model on every call to the UDF, which is hurting the performance of the data pipeline.
The initial code is: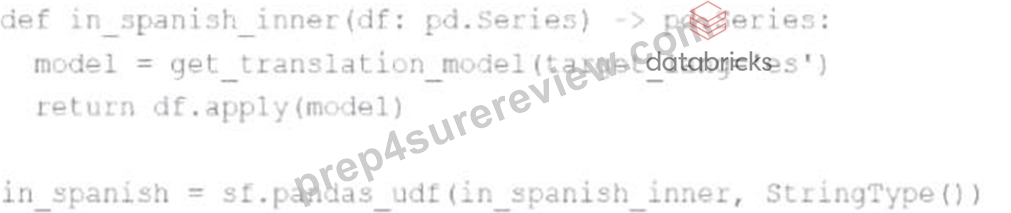
def in_spanish_inner(df: pd.Series) -> pd.Series:
model = get_translation_model(target_lang='es')
return df.apply(model)
in_spanish = sf.pandas_udf(in_spanish_inner, StringType())
How can the MLOps engineer change this code to reduce how many times the language model is loaded?
- A. Run thein_spanish_inner()function in amapInPandas()function call
- B. Convert the Pandas UDF from a Series # Series UDF to an Iterator[Series] # Iterator[Series] UDF
- C. Convert the Pandas UDF to a PySpark UDF
- D. Convert the Pandas UDF from a Series # Series UDF to a Series # Scalar UDF
Answer: B
Explanation:
Comprehensive and Detailed Explanation From Exact Extract:
The provided code defines a Pandas UDF of type Series-to-Series, where a new instance of the language modelis created on each call, which happens per batch. This is inefficient and results in significant overhead due to repeated model initialization.
To reduce the frequency of model loading, the engineer should convert the UDF to an iterator-based Pandas UDF (Iterator[pd.Series] -> Iterator[pd.Series]). This allows the model to be loaded once per executor and reused across multiple batches, rather than once per call.
From the official Databricks documentation:
"Iterator of Series to Iterator of Series UDFs are useful when the UDF initialization is expensive... For example, loading a ML model once per executor rather than once per row/batch."
- Databricks Official Docs: Pandas UDFs
Correct implementation looks like:
python
CopyEdit
@pandas_udf("string")
def translate_udf(batch_iter: Iterator[pd.Series]) -> Iterator[pd.Series]:
model = get_translation_model(target_lang='es')
for batch in batch_iter:
yield batch.apply(model)
This refactor ensures theget_translation_model()is invoked once per executor process, not per batch, significantly improving pipeline performance.
NEW QUESTION # 84
44 of 55.
A data engineer is working on a real-time analytics pipeline using Spark Structured Streaming.
They want the system to process incoming data in micro-batches at a fixed interval of 5 seconds.
Which code snippet fulfills this requirement?
- A. query = df.writeStream \
.outputMode("append") \
.trigger(continuous="5 seconds") \
.start() - B. query = df.writeStream \
.outputMode("append") \
.start() - C. query = df.writeStream \
.outputMode("append") \
.trigger(once=True) \
.start() - D. query = df.writeStream \
.outputMode("append") \
.trigger(processingTime="5 seconds") \
.start()
Answer: D
Explanation:
To process data in fixed micro-batch intervals, use the .trigger(processingTime="interval") option in Structured Streaming.
Correct usage:
query = df.writeStream \
.outputMode("append") \
.trigger(processingTime="5 seconds") \
.start()
This instructs Spark to process available data every 5 seconds.
Why the other options are incorrect:
B: continuous triggers are for continuous processing mode (different execution model).
C: once=True runs the stream a single time (batch mode).
D: Default trigger runs as fast as possible, not fixed intervals.
Reference:
PySpark Structured Streaming Guide - Trigger types: processingTime, once, continuous.
Databricks Exam Guide (June 2025): Section "Structured Streaming" - controlling streaming triggers and batch intervals.
NEW QUESTION # 85
A data engineer noticed improved performance after upgrading from Spark 3.0 to Spark 3.5. The engineer found that Adaptive Query Execution (AQE) was enabled.
Which operation is AQE implementing to improve performance?
- A. Optimizing the layout of Delta files on disk
- B. Improving the performance of single-stage Spark jobs
- C. Dynamically switching join strategies
- D. Collecting persistent table statistics and storing them in the metastore for future use
Answer: C
Explanation:
Comprehensive and Detailed Explanation:
Adaptive Query Execution (AQE) is a Spark 3.x feature that dynamically optimizes query plans at runtime.
One of its core features is:
Dynamically switching join strategies (e.g., from sort-merge to broadcast) based on runtime statistics.
Other AQE capabilities include:
Coalescing shuffle partitions
Skew join handling
Option A is correct.
Option B refers to statistics collection, which is not AQE's primary function.
Option C is too broad and not AQE-specific.
Option D refers to Delta Lake optimizations, unrelated to AQE.
Final Answer: A
NEW QUESTION # 86
......
Associate-Developer-Apache-Spark-3.5 Dumps 100 Pass Guarantee With Latest Demo: https://www.prep4surereview.com/Associate-Developer-Apache-Spark-3.5-latest-braindumps.html
Pass Your Exam With 100% Verified Associate-Developer-Apache-Spark-3.5 Exam Questions: https://drive.google.com/open?id=1GJkWlqLYimUL5lX-CxDDbMuzy3dEktu1
